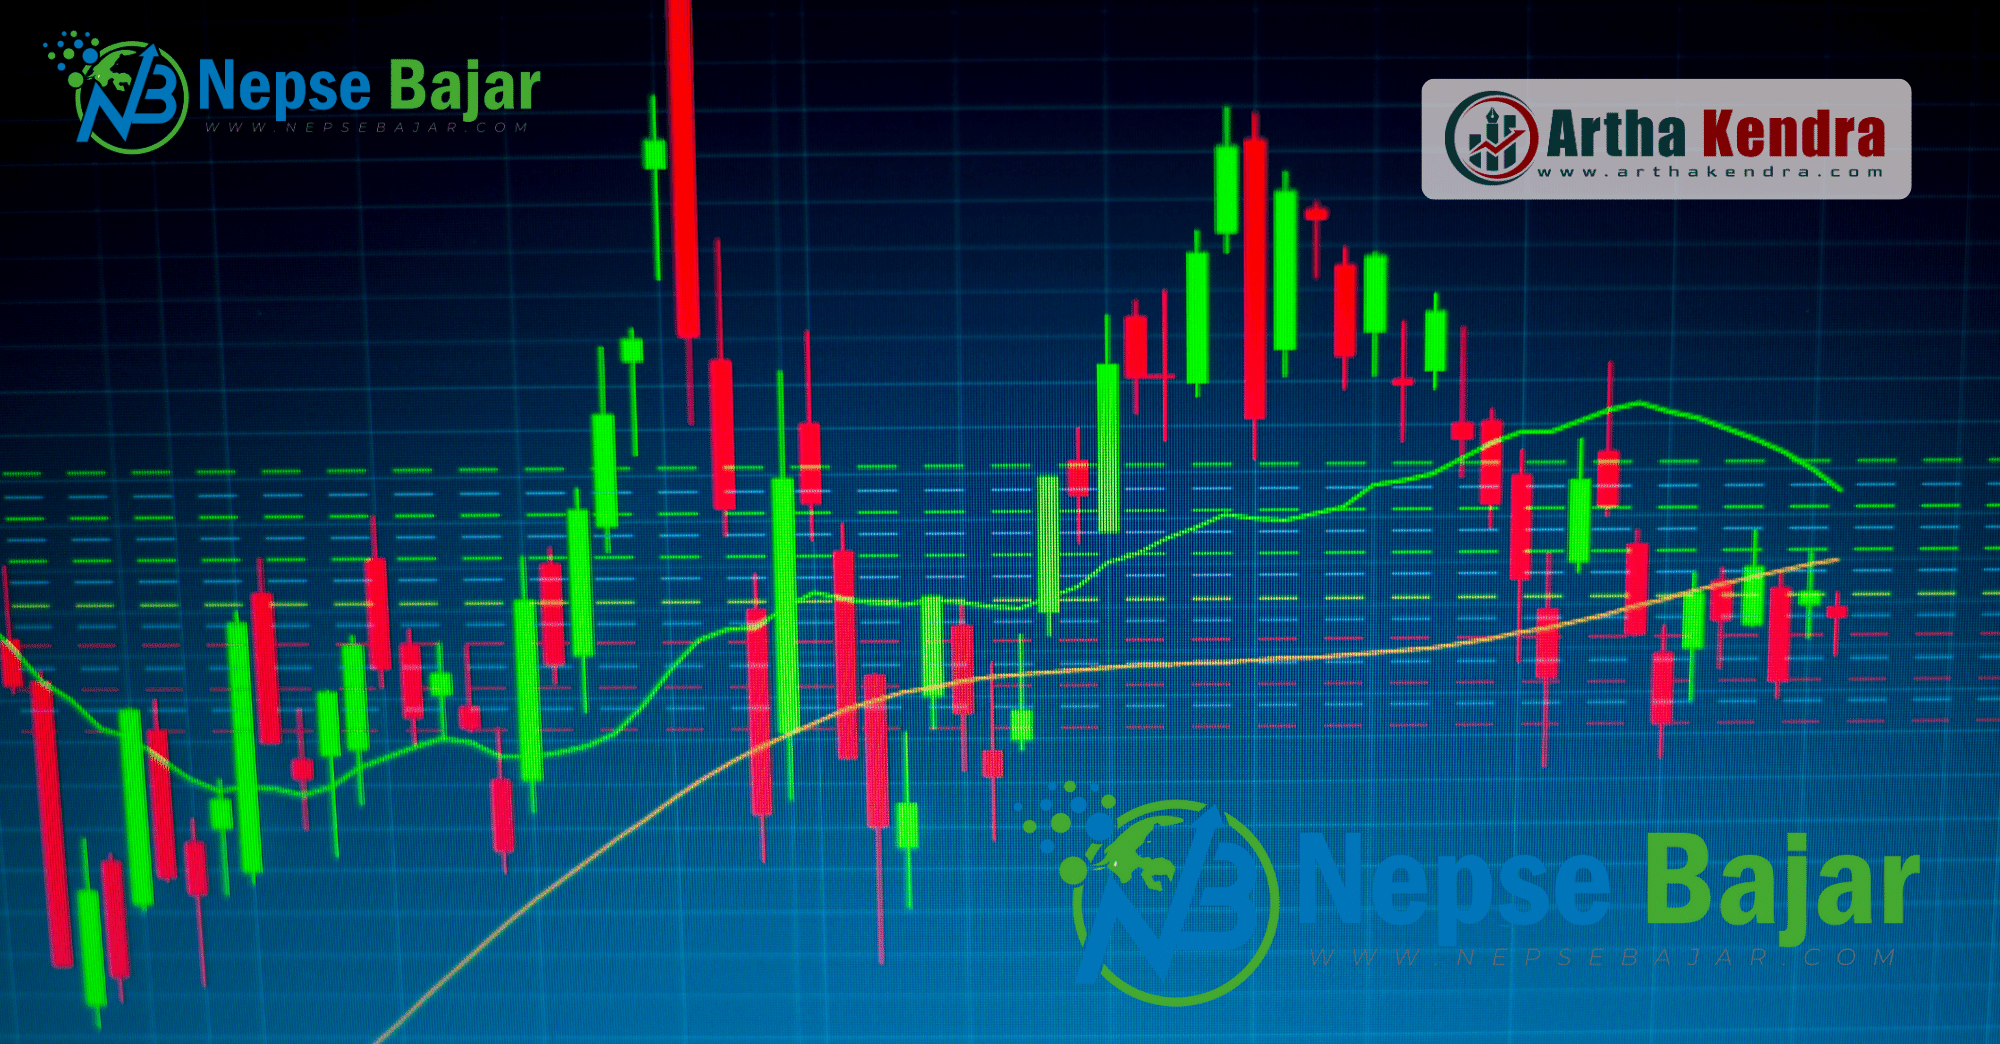
Nepse Bajar Launches Innovative Technical Analysis Chart

Kathmandu, Nepal – In a groundbreaking development for Nepal's financial landscape, Nepse Bajar, the premier online platform dedicated to financial news and analysis, has unveiled its latest feature - the Technical Analysis Chart. This chart, powered by the renowned TradingView Charting Library, is set to revolutionize the way investors, traders, and enthusiasts analyze stock market data.
Nepse Bajar's Journey: Empowering Nepal's Financial Enthusiasts
Established in 2021, Nepse Bajar has been at the forefront of delivering accurate and up-to-the-minute information related to Nepal's share market and financial sector. With a commitment to providing authentic news and facilitating interactive discussions among investors, the platform has gained a loyal following within a short span of time. By launching the Technical Analysis Chart, Nepse Bajar takes its mission a step further, empowering investors with insightful tools to make informed decisions.
Unveiling the Technical Analysis Chart: Redefining Data Analysis
The newly introduced Technical Analysis Chart is set to become an indispensable tool for investors and traders alike. The chart is powered by the TradingView Charting Library, a widely respected platform known for its robust features and user-friendly interface. As a testament to Nepse Bajar's dedication to its users, all features of the TradingView charting library have been seamlessly integrated into the platform.
Investors can access the following features through the Nepse Bajar Technical Analysis Chart:
Live Daily Price Chart: The heart of the charting platform, the live daily price chart provides real-time data on Nepse-listed companies. This feature allows investors to track stock prices, spot trends, and identify potential trading opportunities on a dynamic and interactive chart.
Technical Indicators: The inclusion of various technical indicators such as Moving Averages, Relative Strength Index (RSI), Bollinger Bands, and more empowers users to conduct in-depth technical analysis directly on the platform.
Drawing Tools: The charting library's drawing tools enable users to mark key support and resistance levels, draw trendlines, and make annotations on the chart, facilitating comprehensive analysis.
Multiple Timeframes: With the ability to switch between different timeframes, investors can zoom in on short-term trends or take a broader view of long-term market movements.
Customization Options: Users can personalize the chart's appearance, including color schemes, chart types (line, candlestick, bar, etc.), and visibility of specific indicators.
Social Sharing: The integrated social sharing functionality allows users to share their analyses and insights with the Nepse Bajar community, fostering collaborative learning and idea exchange.
A Free Resource for All
One of the most remarkable aspects of the Nepse Bajar Technical Analysis Chart is that it's freely accessible to all users. This democratization of powerful financial tools aligns perfectly with Nepse Bajar's ethos of providing accessible and valuable resources to Nepal's financial community.
With the launch of the Technical Analysis Chart, Nepse Bajar solidifies its position as a trailblazer in Nepal's financial media landscape. By marrying accurate news reporting with cutting-edge analysis tools, the platform is shaping a new era of informed decision-making within the country's financial sector.
Investors and enthusiasts can access the Technical Analysis Chart directly on the Nepse Bajar website, deepening their understanding of market dynamics and uncovering hidden investment opportunities.
You can visit the chart from here: https://chart.nepsebajar.com


