Mastering Candlestick Patterns: A Comprehensive Guide for Traders
Candlestick patterns are an essential tool in the arsenal of every successful stock trader.
Candlestick patterns are an essential tool in the arsenal of every successful stock trader. These patterns provide valuable insights into market sentiment and can help traders make informed decisions. In this comprehensive guide, we will explore various candlestick patterns, from the basic to the advanced, and discuss their significance in stock market analysis.
- Understanding Candlestick Basics
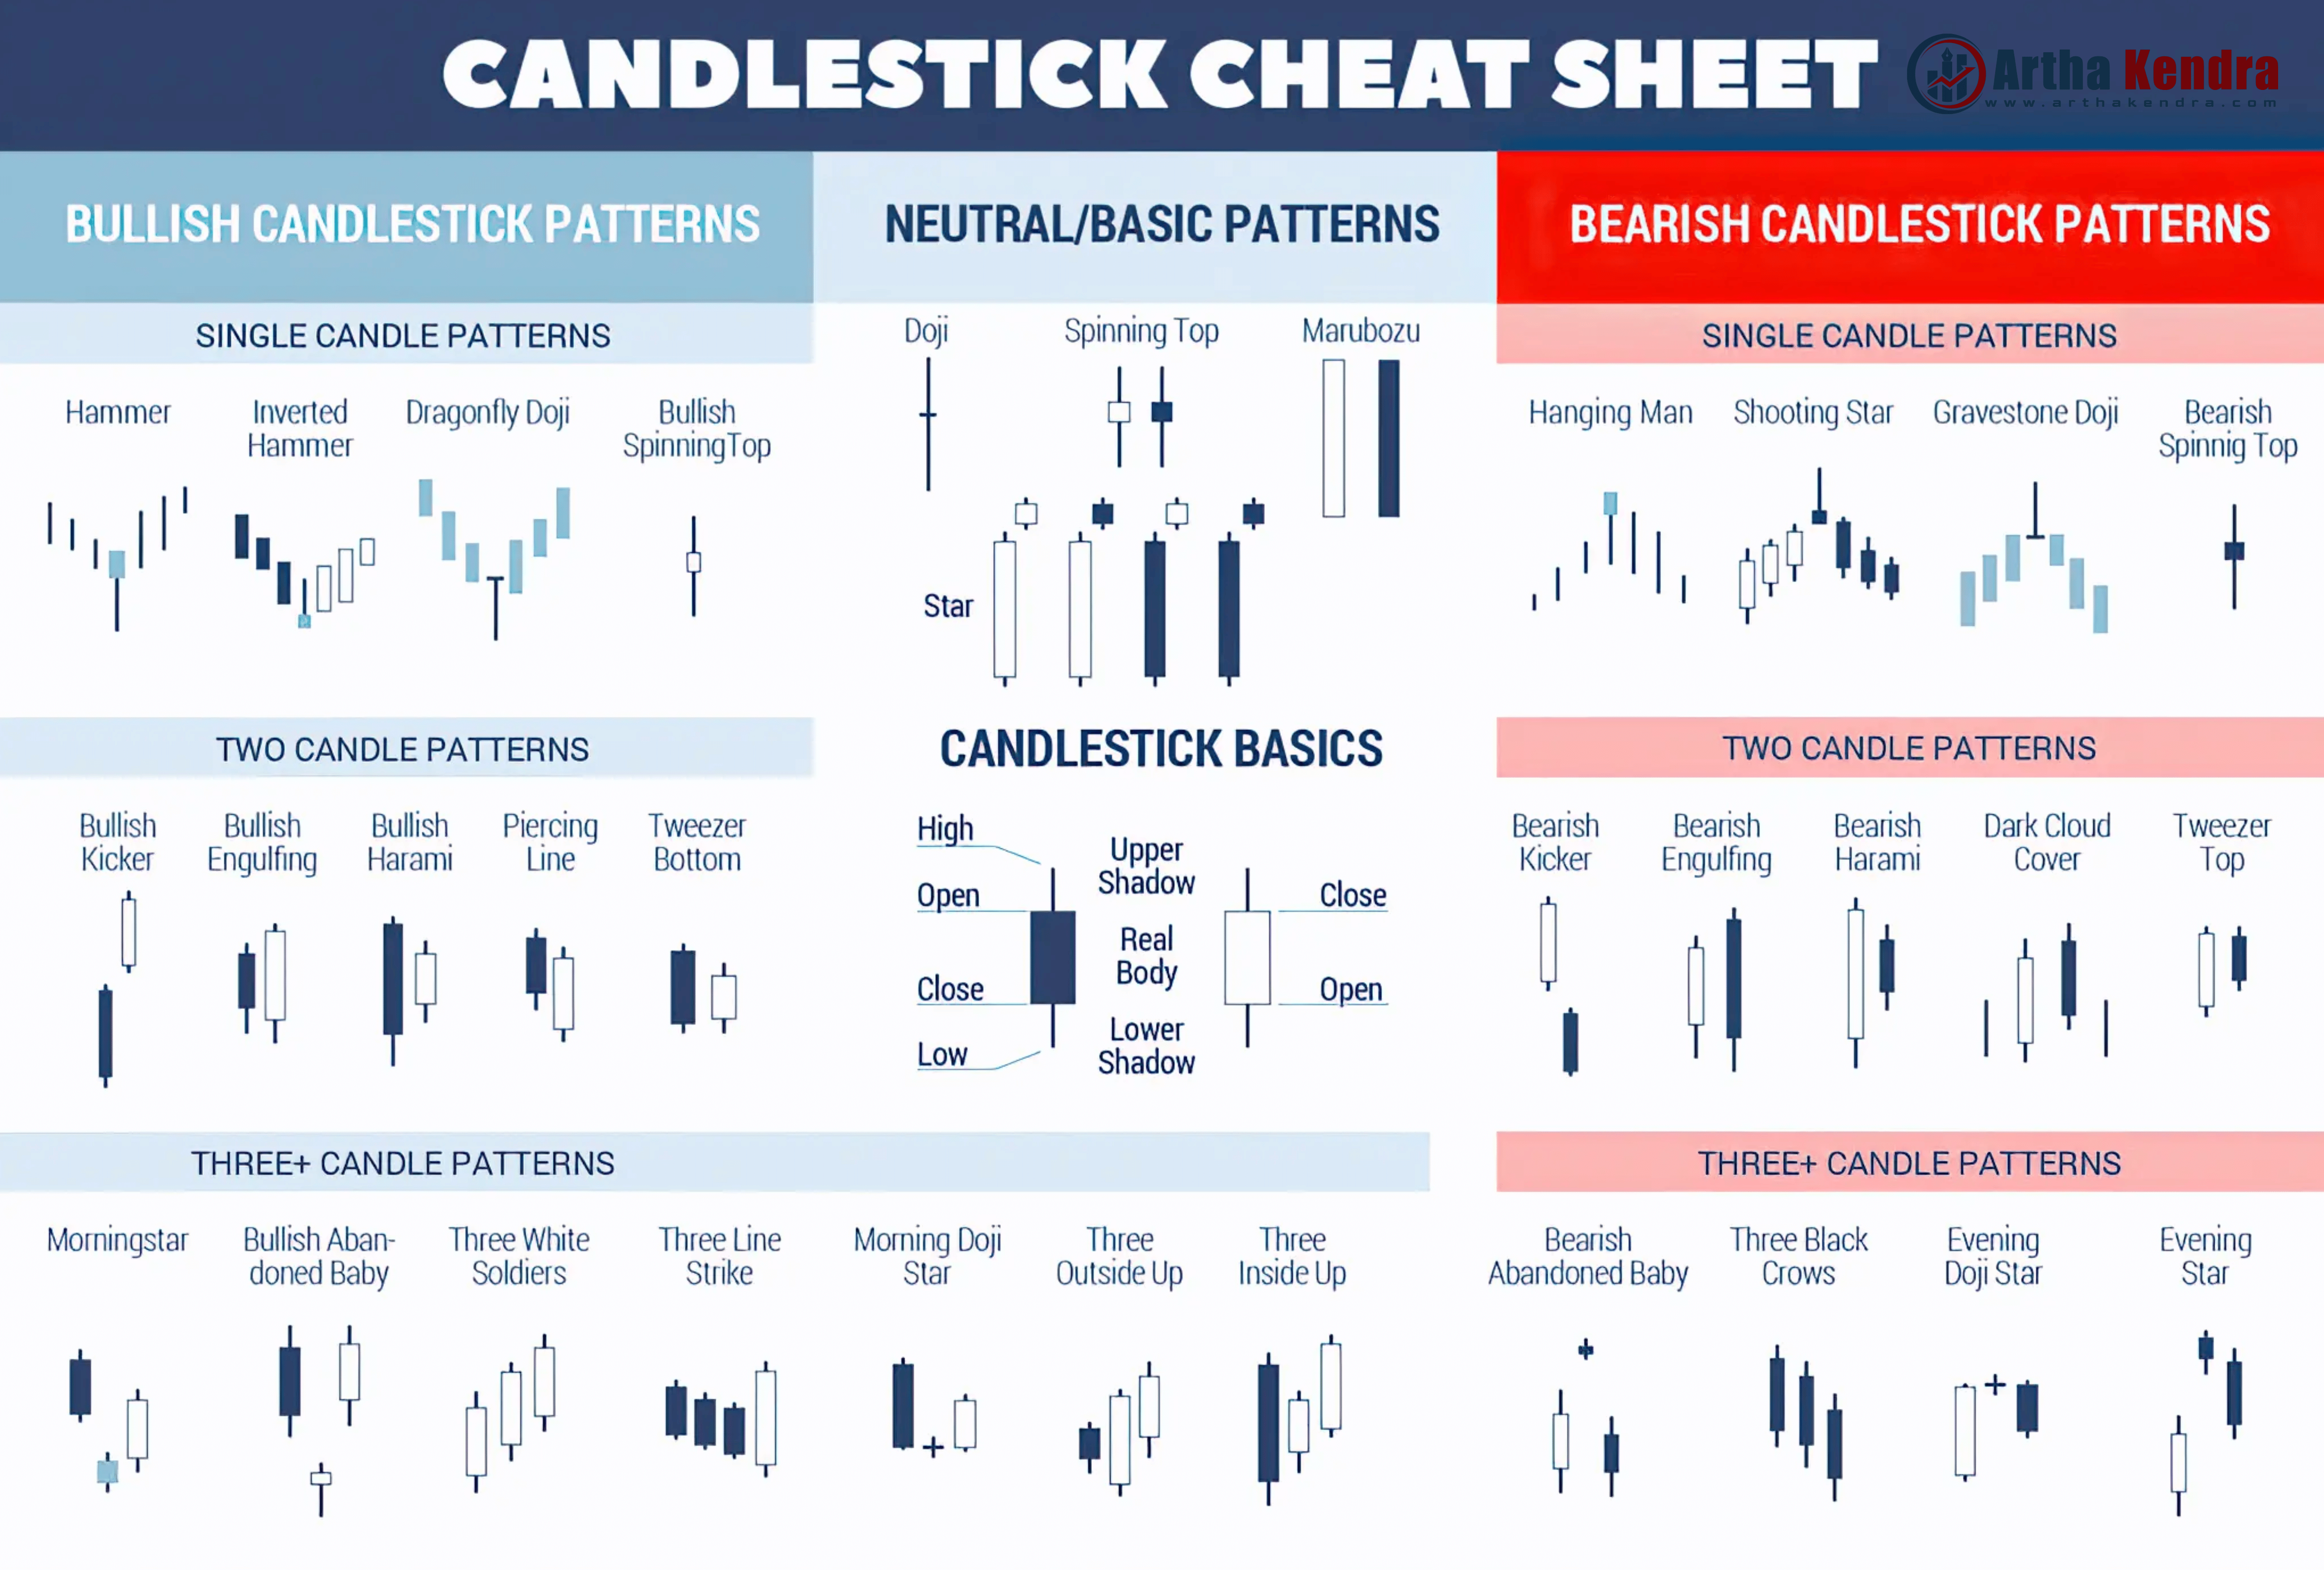
Before diving into specific candlestick patterns, it's crucial to grasp the fundamentals. Candlesticks are visual representations of price movements in a given time frame. Each candlestick consists of four components:
- Open: The price at the beginning of the time period.
- Close: The price at the end of the time period.
- High: The highest price reached during the time period.
- Low: The lowest price reached during the time period.
Candlesticks come in two colors: green or white for bullish (upward) movements and red or black for bearish (downward) movements. The body of the candlestick represents the price range between the open and close, while the thin lines above and below the body are called wicks or shadows, representing the high and low prices.
- Single Candlestick Patterns
2.1. Doji
A Doji candlestick occurs when the open and close prices are nearly the same. It signifies market indecision and can signal a potential reversal.
- Long-legged Doji: Indicates significant uncertainty in the market.
- Dragonfly Doji: Suggests a bullish reversal when it appears at the bottom of a downtrend.
- Gravestone Doji: Suggests a bearish reversal when it appears at the top of an uptrend.
2.2. Hammer and Hanging Man
- Hammer: Appears at the bottom of a downtrend and signals a potential bullish reversal.
- Hanging Man: Appears at the top of an uptrend and suggests a potential bearish reversal.
- Two-Candlestick Patterns
3.1. Bullish Engulfing
A bullish engulfing pattern occurs when a small bearish candlestick is followed by a larger bullish candlestick. It suggests a potential upward reversal.
3.2. Bearish Engulfing
Conversely, a bearish engulfing pattern occurs when a small bullish candlestick is followed by a larger bearish candlestick, indicating a potential downward reversal.
3.3. Tweezer Tops and Bottoms
- Tweezer Tops: Two consecutive candlesticks with identical or nearly identical highs, signaling a potential reversal to the downside.
- Tweezer Bottoms: Two consecutive candlesticks with identical or nearly identical lows, suggesting a potential reversal to the upside.
- Three-Candlestick Patterns
4.1. Morning Star
A morning star pattern is a bullish reversal signal consisting of three candles:
- A long bearish candle.
- A small bullish or bearish candle with a gap down.
- A long bullish candle that opens higher than the second candle, suggesting a potential uptrend.
4.2. Evening Star
An evening star pattern is a bearish reversal signal and is the opposite of the morning star pattern:
- A long bullish candle.
- A small bullish or bearish candle with a gap up.
- A long bearish candle that opens lower than the second candle, suggesting a potential downtrend.
- Continuation Patterns
5.1. Bullish Harami
A bullish harami pattern consists of two candles:
- The first candle is bearish.
- The second candle is a small bullish candle that is completely engulfed by the first candle, suggesting a potential continuation of the uptrend.
5.2. Bearish Harami
A bearish harami pattern is the opposite of the bullish harami:
- The first candle is bullish.
- The second candle is a small bearish candle that is completely engulfed by the first candle, suggesting a potential continuation of the downtrend.
Candlestick patterns are a valuable tool for traders to understand market sentiment and make informed decisions. While this guide covers some of the most common patterns, there are many more to explore. Traders should combine candlestick analysis with other technical and fundamental analysis techniques for a comprehensive approach to stock market trading. Remember that no single pattern guarantees success, and risk management should always be a priority in trading. Happy trading!
Comments
0 comments · join the conversation
No comments yet
Be the first to share your thoughts.
Add a comment
Your comment will appear after a quick review.
Comment submitted
Thanks! Your comment is in the moderation queue and will appear after verification.
Reply to comment
0 replies
Reply submitted
Thanks! Your reply is in the moderation queue and will appear after verification.